ubuntu安装prometheus
大约 4 分钟
ubuntu安装prometheus
安装 prometheus
使用预编译的二进制安装包
下载地址
Download | Prometheus - Prometheus 监控系统
解压压缩包
tar -zxvf prometheus-xxx.linux-amd64.tar.gz
解压后的文件目录 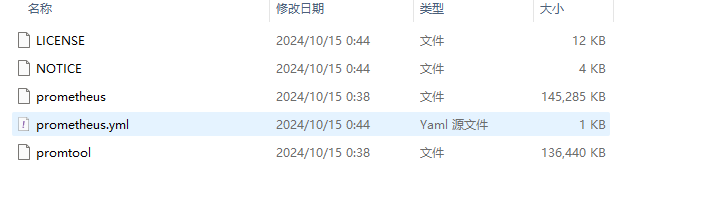
- prometheus 是主程序的二进制包
- prometheus.yml 是主要配置文件
配置prometheus
解压文件可以放在/opt/prometheus目录下 需要新建两个目录:
- host:存放主机的配置文件
- rules:存放报警规则配置文件
/opt/prometheus/prometheus.yml
# my global config

global:
  scrape_interval: 15s # Set the scrape interval to every 15 seconds. Default is every 1 minute.
  evaluation_interval: 15s # Evaluate rules every 15 seconds. The default is every 1 minute.
# 配置报警器,alertmanager服务器的ip和端口
alerting:
  alertmanagers:
    - static_configs:
        - targets:
          # - alertmanager:9093

# 报警规则配置文件
rule_files:
  # - "first_rules.yml"
  # - "second_rules.yml"
  - "/opt/prometheus/rules/*.yml"
# 设置抓取任务,可以按不同类型服务器分成不同任务
scrape_configs:
  - job_name: "prometheus"
    static_configs:
      - targets: ["localhost:9090"]
  - job_name: "linux-server"
	file_sd_configs:
	- refresh_interval: 60s
	  files:
	  - "/opt/prometheus/host/linux.yml"
host目录下linux.yml
- targets:
  - "xxx.xxx.xxx.xxx:9100"
  labels:
    hostname: server01.com
    group: linux-server
rules目录下的规则.yml
groups:
- name: linux
  rules:
  # 服务器在线情况
  - alert: 服务器离线报警
    expr: up == 0
    for: 10s
    labels:
      severity: critical
    annotations:
      summary: 离线的服务器地址: {{ $labels.instance }}
      description: "服务器在线情况  VALUE = {{ $value }}\n  服务器标签 = {{ $labels }}"

  # CPU使用率
  - alert: 服务器CPU报警
    expr: 100 - (avg by(instance) (rate(node_cpu_seconds_total{mode="idle"}[2m])) * 100) > 80
    for: 1m
    labels:
      severity: warning
    annotations:
      summary: 报警服务器地址:  {{ $labels.instance }}
      description: "服务器CPU负载超过 80% \n  CPU使用率 = {{ $value }} \n  服务器标签 = {{ $labels }}"

  # 内存剩余量
  - alert: 服务器内存报警
    expr: node_memory_MemAvailable_bytes / node_memory_MemTotal_bytes * 100 < 10
    for: 1m
    labels:
      severity: warning
    annotations:
      summary: 报警服务器地址: {{ $labels.instance }}
      description: "服务器内存小于 10%  \n  内存使用量 = {{ $value }} \n  服务器标签 = {{ $labels }}"

  # 硬盘读取
  - alert: 硬盘读取速度报警
    expr: sum by (instance) (rate(node_disk_read_bytes_total[2m])) / 1024 / 1024 > 90
    for: 1m
    labels:
      severity: warning
    annotations:
      summary: 报警服务器地址: {{ $labels.instance }}
      description: "服务器硬盘读取速度大于 90 MB/s \n  读取速度 = {{ $value }} \n  服务器标签 = {{ $labels }}"

  # 硬盘写入
  - alert: 硬盘写入速度报警
    expr: sum by (instance) (rate(node_disk_written_bytes_total[2m])) / 1024 / 1024 > 90
    for: 1m
    labels:
      severity: warning
    annotations:
      summary: Host unusual disk write rate (instance {{ $labels.instance }})
      description: "服务器硬盘写入速度大于> 90 MB/s \n  写入速度 = {{ $value }} \n  服务器标签 = {{ $labels }}"

  # 网络接收
  - alert: 网络接收速度报警
    expr: sum by (instance) (rate(node_network_receive_bytes_total[2m])) / 1024 / 1024 > 100
    for: 1m
    labels:
      severity: warning
    annotations:
      summary: Host unusual network throughput in (instance {{ $labels.instance }})
      description: "服务器网络接收速度大于 100 MB/s \n  网络接收速度 = {{ $value }} \n  服务器标签 = {{ $labels }}"

  # 网络发送
  - alert: 网络发送速度报警
    expr: sum by (instance) (rate(node_network_transmit_bytes_total[2m])) / 1024 / 1024 > 100
    for: 1m
    labels:
      severity: warning
    annotations:
      summary: Host unusual network throughput out (instance {{ $labels.instance }})
      description: "服务器网络发送速度大于 100 MB/s \n  网络发送速度 = {{ $value }} \n  LABELS = {{ $labels }}"
配置prometheus为系统服务
/lib/systemd/system/prometheus.service
[Unit]
Description=Prometheus Node Exporter
After=network.target

[Service]
ExecStart=/opt/prometheus/prometheus --config.file=/opt/prometheus/prometheus.yml --web.read-timeout=5m  --web.max-connections=10 --storage.tsdb.retention=15d --storage.tsdb.path=/opt/prometheus/data --query.max-concurrency=20 --query.timeout=2m
User=root
[Install]
WantedBy=multi-user.target
安装alertmanager
使用预编译的二进制安装包
下载地址
Download | Prometheus - Prometheus 监控系统
解压压缩包
tar -zxvf alertmanager-xxx.linux-amd64.tar.gz 解压后的文件目录 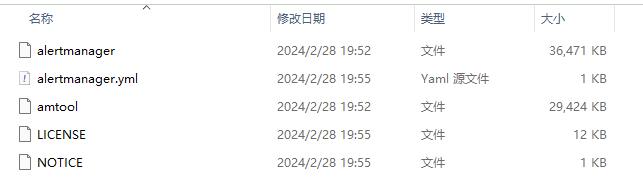
- alertmanager:二进制程序
- alertmanager.yml:配置文件
配置alertmanager
把解压后的文件放入到/opt/alertmanager /opt/alertmanager/alertmanager.yml
route:
  # 警告分组
  group_by: ['alertname']
  # 警告触发30秒后,发送警告
  group_wait: 30s
  # 每5分钟报警一次
  group_interval: 5m
  # 重新发送警告1小时
  repeat_interval: 1h
  # 使用webhook推送警告
  receiver: 'web.hook'
# 接收器配置
receivers:
  - name: 'web.hook'
    # webhook服务器地址
    webhook_configs:
      - url: 'http://127.0.0.1:5001/'
# 报警规则
inhibit_rules:
  # 匹配关键字
  - source_match:
      severity: 'critical'
    target_match:
      severity: 'critical'
    equal: ['alertname', 'dev', 'instance']
把alertmanager注册为系统服务
/etc/systemd/system/alertmanager.service
[Unit]
Description=alertmanager
Documentation=https://prometheus.io/download/#alertmanager
After=network.target
[Service]
Type=simple
ExecStart=/opt/alertmanager/alertmanager --config.file=/opt/alertmanager/config.yml
Restart=on-failure
[Install]
WantedBy=multi-user.target
安装prometheus-webhook-dingtalk
下载
Releases · timonwong/prometheus-webhook-dingtalk
解压压缩包
tar -zxvf prometheus-webhook-dingtalk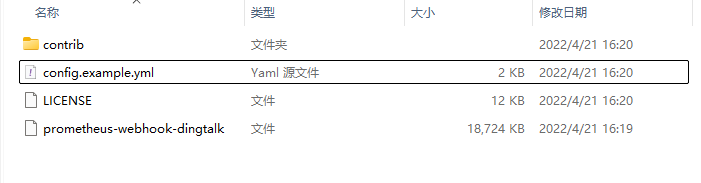
配置推送钉钉机器人
把解压的文件放到/opt/prometheus-webhook-dingtalk /opt/prometheus-webhook-dingtalk/config.yml
targets:
  webhook1:
    url: https://oapi.dingtalk.com/robot/send?access_token=xxxxxx
    # secret for signature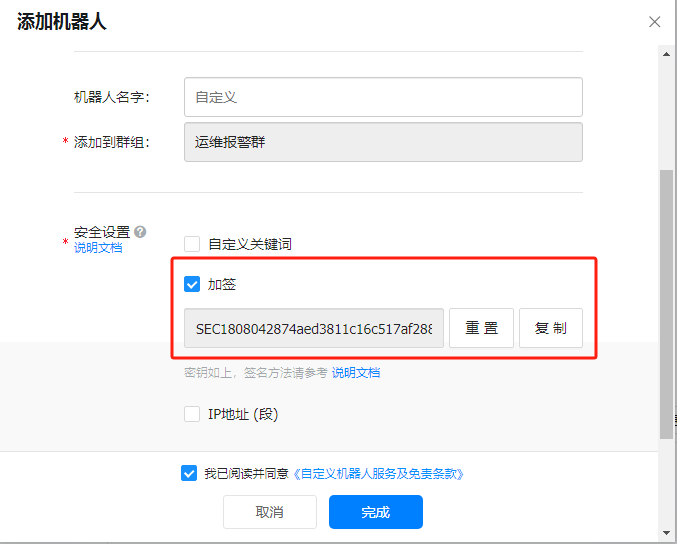
secret: xxxxxx- 钉钉机器人的webhook地址对应配置文件的url
- 钉钉机器人的加签数据对应的配置文件的secret
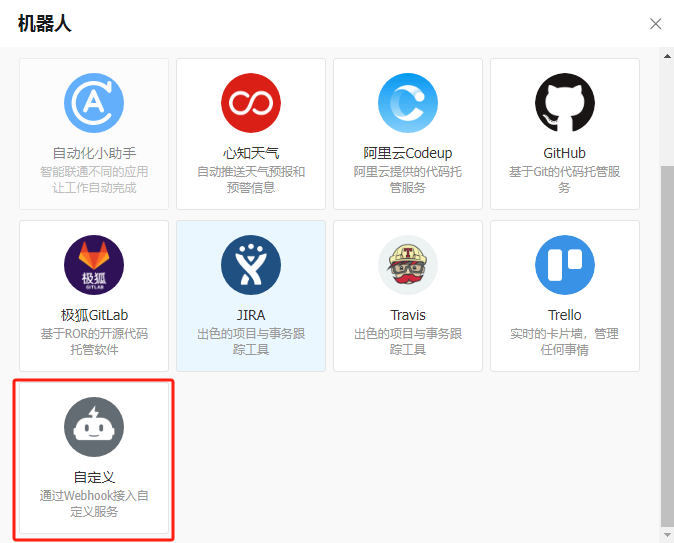
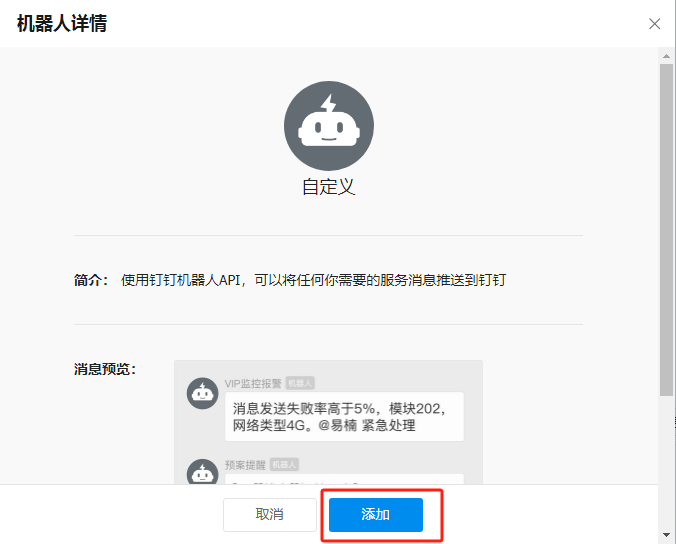
配置钉钉

注册成系统服务
/etc/systemd/system/prometheus-webhook-dingtalk.service
[Unit]
Description=prometheus-webhook-dingtalk
Documentation=https://github.com/timonwong/prometheus-webhook-dingtalk
After=network.target
[Service]
Type=simple
ExecStart=/opt/prometheus-webhook-dingtalk/prometheus-webhook-dingtalk --config.file=/opt/prometheus-webhook-dingtalk/config.yml
Restart=on-failure
[Install]
WantedBy=multi-user.target